This is what Europe's agriculture looks like in 2030
2018.12.14: By 2030 Europeans will eat less meat and drink less milk. But production will be stable, according to the European Commission. This places high demands on how the milk and meat are produced, says researchers Annika Svanbäck and Michelle McCrackin of the Baltic Sea Centre.
Liquid milk consumption is expected to further decline in the EU, as does the consumption of beef and pigmeat. This according to the EU Commission’s latest analysis of agricultural development for markets and income until 2030.
As milk and meat production in the Baltic Sea region contributes to the nutrient load from land to sea, the Commission's prediction should be good news for the Baltic Sea. But in reality, things are not that simple. Even as consumption decreases, total production will be the same or increase slightly by 2030. This due to increased exports of for instance milk, dairy products, pigmeat and poultry.
– The Commission's report shows that the environmental impact of the food industry is a global issue. The regional link between consumption and production is not straightforward, says Annika Svanbäck, agronomist and researcher at the Baltic Sea Centre.
Recently, she and research colleague Michelle McCrackin published a fact sheet about how trade, production and consumption of plant and animal products affect the eutrophication in the Baltic Sea. An important factor is that consumption of animal products has increased sharply since the mid-1990s – and continues to increase.
– The negative consequences of production remain in the region even though we export the end products. So even if we eat less meat in the Baltic Sea Region, it doesn’t necessarily mean that the negative impact of agriculture on the Baltic Sea will be reduced, says Michelle McCracking.
Generally, it is good for both climate and other environmental issues to reduce consumption of animal products. Producing and consuming animal products requires more resources (water, fossil fuels, nitrogen and phosphorus) per amount of protein or calories compared with the production of plant-based food. But then the reduction must take place on a global scale.
– How the food is produced is another important factor, says Annika Svanbäck.
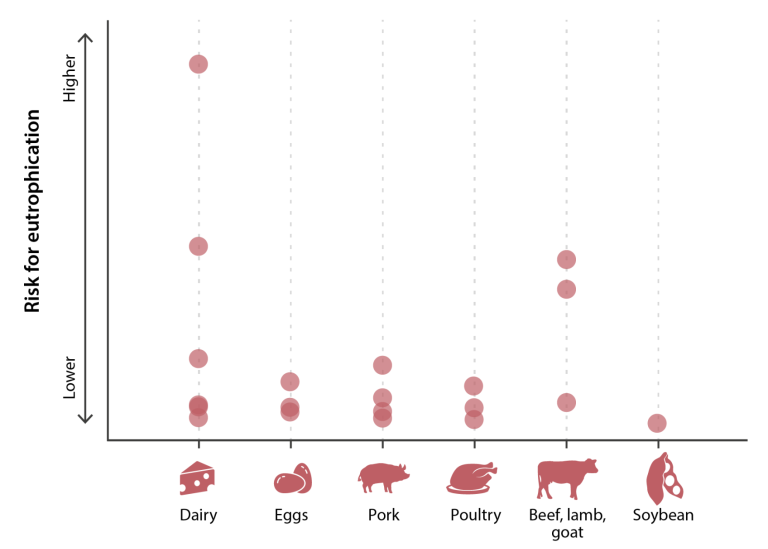
The environmental impact of animal production varies widely between different regions, production systems and types of products, and the risk of nutrient leakage also depends on local conditions.
– Some animal husbandry systems may have low nutrient emissions per kilogram of food, but high nutrient losses per area of cultivated arable land. It is important to consider the total amount of eutrophication and the risk of nutrient leakage at the place where the animals are kept, says Annika Svanbäck.
If meat production in the Baltic Sea region remains at a high level, or even increases, over the coming decades, farmers must generally be better at reducing nutrient surpluses, according to Annika Svanbäck.
– In some parts of the catchment there is, for example, a high potential for using manure more efficiently and reduce the dependence on imported fertilisers, she says.
Text: Henrik Hamrén
FACT BOX: This is what Europe's agriculture looks like in 2030
Arable crops
- Total agricultural land use will continue to decline, to about 176 million ha.
- The area of main cereals, permanent grasslands and permanent crops will decline.
- Increased land use for fodder.
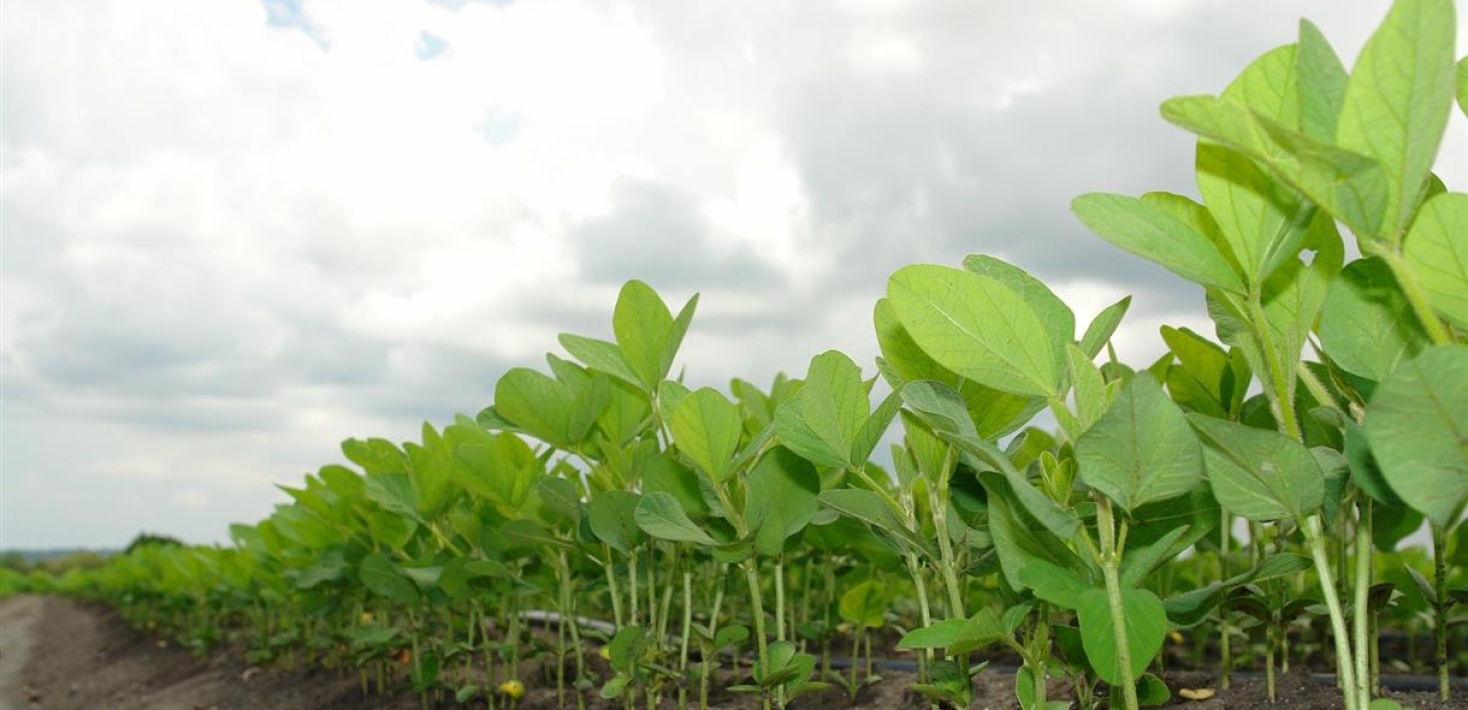
- Increased production of soy and other protein crops.
- Biofuel production levels remain stable overall.
Meat
- Meat production will stay at about 48 million t per year. However, the shares of different meats will change.
- Decrease in total livestock numbers.
- 90% of total EU meat production is consumed domestically.
- Slight recovery for sheep and goat meat production.
- Pigmeat consumption declines, which leads to increased export to world markets, mostly China.
- Significant increase in both production and consumption of poultry (about 4% increase each).
- Increased export of poultry to countries outside the EU.
Milk and dairy products
- Growing world demand and consumption (notably in Africa).
- Modest increase in milk production, at 0,8% per year, reaching 182 million t by 2030.
- Further decline of liquid milk consumption in the EU.
- More focus on ”value-added products”.
- EU supplies 35% of the global demand increase.
- Increased EU export of cheese, butter, skimmed milk powder, whole milk powder and whey powder.
- Close to 900 000 t of additional milk per year would be needed to satisfy the growth in EU use for ”traditional” dairy products (mainly cheese).
Consumption and economy
- Stabilisation of agricultural income per labour unit up to 2030.
- Increase in production value (by 17%), outweighed by increase in production costs (stemming mainly from higher energy prices and stronger depreciation).
- Continued labour outflow, fewer farmers.
- Stronger opportunity for farmers to differentiate their products and adding value to certain products.
- Increased consumer demands towards food and its sourcing, its impact on the environment and climate change.
- Increase in demand for organic and locally produced food.
Environment and climate
- Total emissions of greenhouse gases from agriculture remain stable compared with 2012 levels. The emissions from meat production goes down while the emissions from crop production and manure application contributes to an increase.
- Ammonia emissions will decrease (by 9%).
- The total nitrogen (N) losses to EU waters will go down by 8% compared to 2012 – despite an increase in N runoff (+3%) due to an increase in mineral fertilisers.
Last updated: January 30, 2023
Source: Östersjöcentrum