Deglaciation drove seawater infiltration and slowed submarine groundwater discharge
ten Hietbrink, S., Patton, H., Dugan, B., Szymczycha, B., Sen, A., Lepland, A., Knies, J., Kim, J-H., Chen, N-C., & Hong, W-L., 2025. Deglaciation drove seawater infiltration and slowed submarine groundwater discharge. Nature Geoscience. https://doi.org/10.1038/s41561-025-01750-z
Abstract
Submarine groundwater discharge – the flow of groundwater into the ocean – plays an important role in shaping coastal biogeochemical cycles. The absence of temporal constraints on offshore groundwater dynamics driven by proximal glacial loading hinders our assessment of how its circulation may vary in conceivable ice-free polar regions. Here we estimate residence times of saline groundwater at an active submarine groundwater discharge and methane seep site off the coast of northern Norway, near the continental shelf break. The subsurface hydrology in this area experienced drastic changes due to Fennoscandian Ice Sheet dynamics, offering insights into the consequences of glacial – interglacial transitions for offshore groundwater. Using radiocarbon dating of dissolved inorganic carbon in the upwards-advected groundwater, we determined saline groundwater residence times of 11.5 to 8.8 kyr and 4.8 to 2.6 kyr at two distinct discharge sites. The presence of a meteoric water component in sediment porewaters confirms offshore groundwater freshening driven by past glacial loading. This indicates that, as the ice sheet retreated and sea levels rose, seawater began to infiltrate the subsurface, replacing freshwater recharge. Our results provide observational evidence pinpointing the onset of seawater infiltration following deglaciation of the margin. These findings suggest that retreating marine-terminating glaciers will profoundly alter offshore groundwater composition and reduce discharge rates.
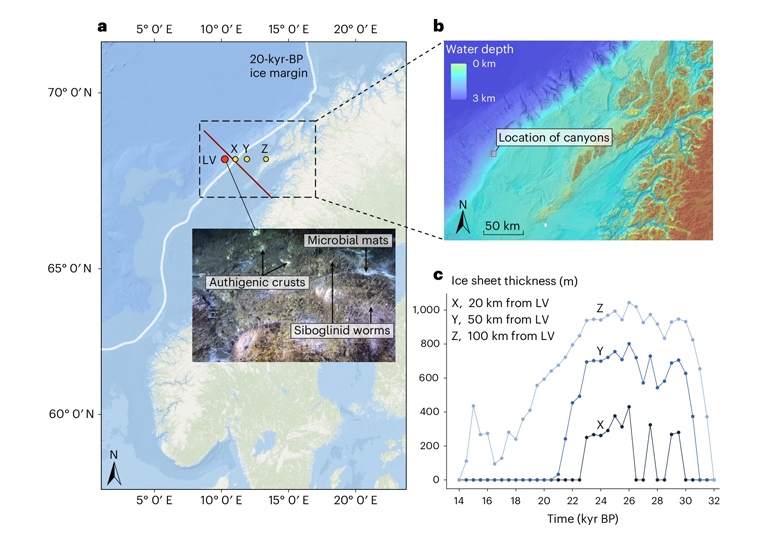
a,b, Cores were taken 80 km west of the Lofoten Archipelago offshore northern Norway at ca. 800 m water depth (a, with zoom in b). The sample site is indicated by the red dot with the label ‘LV’. The yellow markers with labels ‘X’, ‘Y’ and ‘Z’ indicate the locations where ice sheet thickness data were extracted from a numerical model. The dark-red line indicates the position of the geological profile shown in Extended Data Fig. 1. The 20-kyr-BP ice margin extent was redrawn from ref. 45. Two canyons in the area are characterized by submarine groundwater discharge and cold seep features such as microbial mats, siboglinid worms and crusts of authigenic carbonate and barite17,28. Push cores were obtained from two habitats: microbial mats (BacMat) and worm tuff (Worm). In addition, a background core (Background) upslope just outside of the discharge area was obtained. c, Ice sheet thickness between 32 and 14 kyr BP at three locations east of the LV site (‘X’, ‘Y’ and ‘Z’ from a). Basemap data in b from the GEBCO_2024 Grid (https://doi.org/10.5285/1c44ce99-0a0d-5f4f-e063-7086abc0ea0f). Credit: basemap in a, Esri, Garmin, GEBCO, NOAA NGDC and other contributors (https://www.arcgis.com/home/item.html?id=67ab7f7c535c4687b6518e6d2343e8a2).